Docs / Compare results
Compare results
Make informed decisions about model and prompt changes by comparing experiment results side-by-side. Understand performance differences across metrics, drill into specific examples, and share findings with stakeholders.
Effective comparison workflows help teams move beyond intuition to data-driven decision making. By systematically analyzing differences between experiments, you can identify which changes truly improve performance and avoid regressions that might not be immediately obvious.
Evaligo's comparison tools enable both high-level metric analysis and detailed, row-by-row examination of results. This multi-level approach ensures you catch both statistical trends and nuanced changes in output quality that aggregate metrics might miss.
Evaluator Scores Comparison
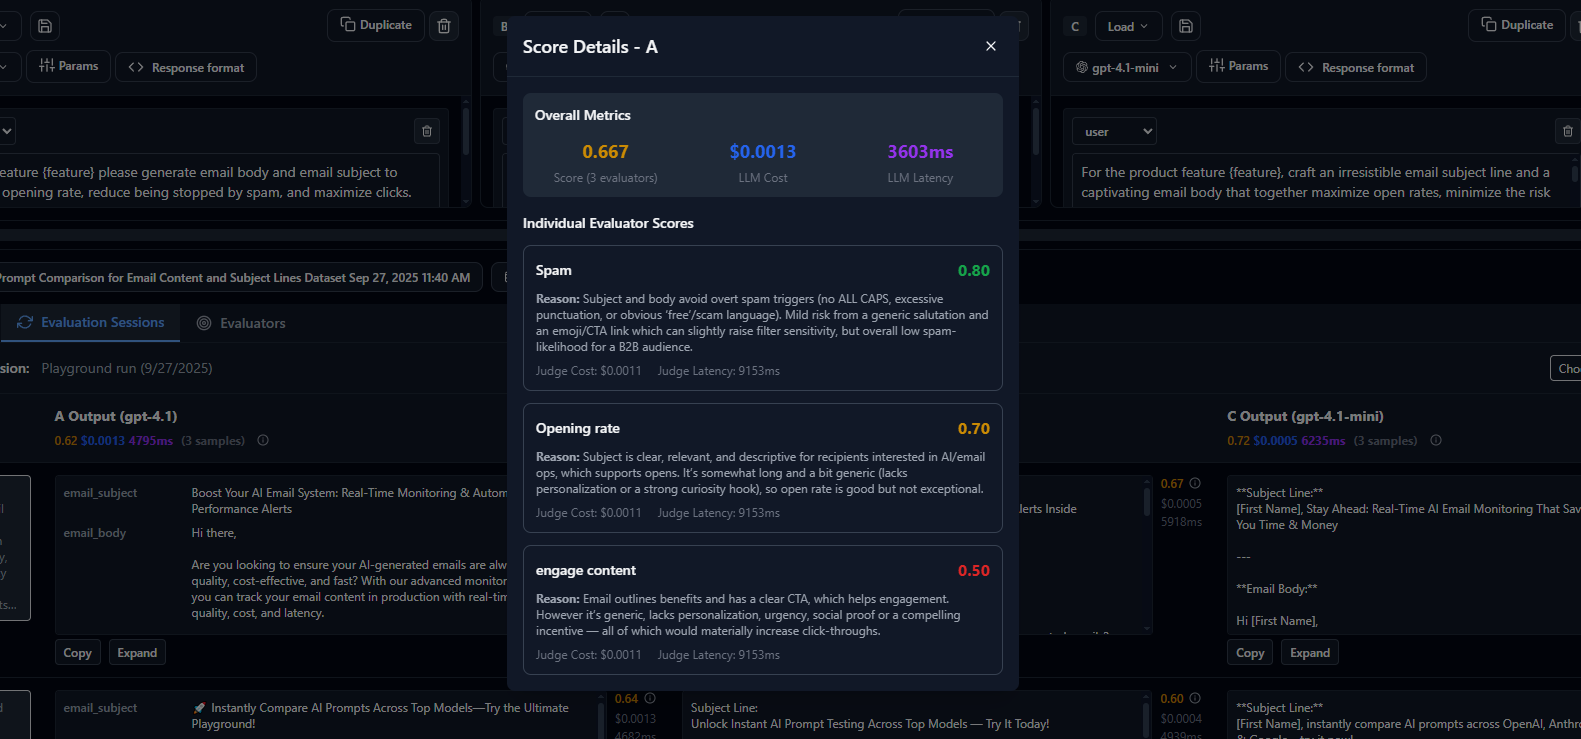
Metric-Level Comparison
Start with high-level metrics to understand overall performance differences between experiments. Look for statistically significant changes in accuracy, latency, cost, and custom evaluation scores to guide your analysis.
- 1
Select experiments to compare Choose baseline and candidate experiments, ensuring they use the same dataset for fair comparison.
- 2
Review aggregate metrics Examine accuracy, F1 scores, latency percentiles, and cost per request to identify significant differences.
- 3
Check statistical significance Use confidence intervals and p-values to determine if observed differences are meaningful.
- 4
Identify performance trade-offs Understand relationships between accuracy, cost, and latency to make informed decisions.
Statistical Significance: Look for confidence intervals that don't overlap and p-values below your significance threshold (typically 0.05) to ensure observed differences aren't due to random variation.
# Compare two experiments programmatically
baseline = client.experiments.get("gpt-35-baseline-v1")
candidate = client.experiments.get("gpt-4-optimized-v2")

comparison = client.experiments.compare(
    baseline_id=baseline.id,
    candidate_id=candidate.id,
    metrics=["accuracy", "latency_p95", "cost_per_request"],
    confidence_level=0.95
)

# Check for significant improvements
if comparison.accuracy.is_significant and comparison.accuracy.delta > 0.05:
    print(f"Significant accuracy improvement: {comparison.accuracy.delta:.2%}")
    print(f"Confidence interval: {comparison.accuracy.confidence_interval}")

# Analyze trade-offs
if comparison.cost_per_request.delta > 0.20:  # 20% cost increase
    cost_per_accuracy = comparison.cost_per_request.delta / comparison.accuracy.delta
    print(f"Cost per accuracy point: ${cost_per_accuracy:.4f}")
Row-Level Analysis
Drill down into individual test cases to understand how changes affect specific types of inputs. This qualitative analysis often reveals patterns that aggregate metrics miss and helps identify edge cases where the model struggles.
Row-level comparison is particularly valuable for understanding changes in output style, reasoning quality, or handling of edge cases. By examining specific examples where performance differs, you can gain insights into the underlying model behavior changes.
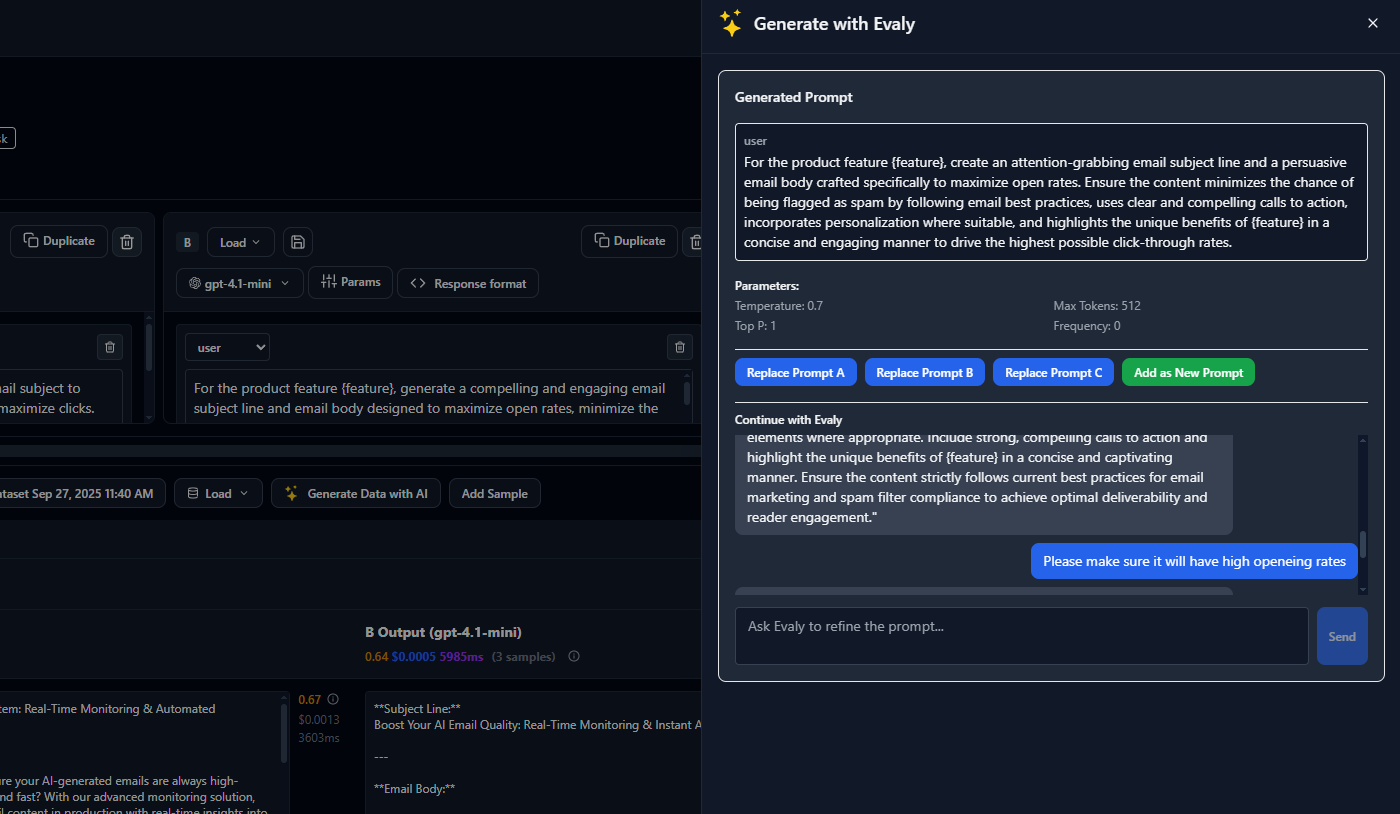
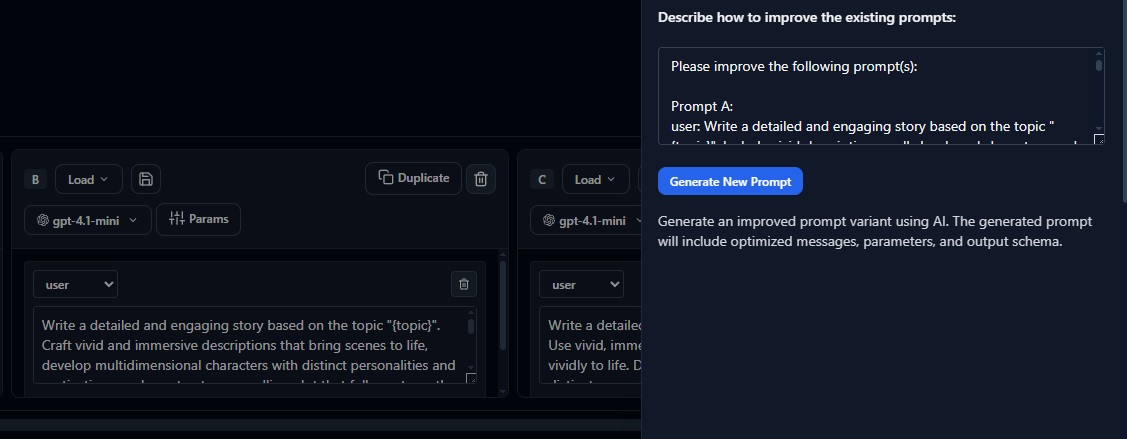
AI-Generated Prompt Optimization
- 1
Filter to interesting cases Focus on rows where experiments disagree or where evaluator scores differ significantly.
- 2
Examine output differences Compare response quality, style, factual accuracy, and reasoning between variants.
- 3
Review evaluator feedback Understand why evaluators scored outputs differently and identify patterns in feedback.
- 4
Categorize findings Group similar differences to understand systematic changes in model behavior.
Sampling Strategy: Focus on rows with the largest score differences, disagreements between evaluators, or cases that represent critical business scenarios for your application.
Video
Sharing and Documentation
Export comparison results and create shareable reports for stakeholders. Document your findings, decisions, and rationale to maintain transparency and enable future teams to understand the evolution of your AI system.
Well-documented comparisons serve as valuable historical records that help teams understand why certain decisions were made and provide context for future optimization efforts. This documentation is especially important for regulatory compliance and audit requirements.
# Generate a comprehensive comparison report
report = comparison.generate_report(
    title="GPT-4 Migration Impact Analysis",
    description="Evaluating accuracy and cost trade-offs for customer support automation",
    include_sections=[
        "executive_summary",
        "metric_comparison",
        "row_level_analysis",
        "recommendations"
    ],
    sample_size=50,  # Include 50 example rows
    format="pdf"
)

# Share with stakeholders
report.share_with([
    "product@company.com",
    "engineering@company.com",
    "ai-team@company.com"
])

# Attach to pull request
github_integration.comment_on_pr(
    pr_number=123,
    content=f"""
    ## 🔬 Experiment Comparison Results

    **Accuracy Change:** {comparison.accuracy.delta:+.1%} ({comparison.accuracy.significance})
    **Cost Impact:** {comparison.cost_per_request.delta:+.1%}
    **Latency Change:** {comparison.latency_p95.delta:+.0f}ms

    [View detailed analysis]({report.url})

    **Recommendation:** {report.recommendation}
    """
)
Automated Decision Making
Set up automated rules and thresholds to streamline decision making for routine comparisons. This enables faster iteration cycles while maintaining quality standards through systematic evaluation criteria.
Automation Guidelines: Start with conservative thresholds and gradually refine them based on historical performance. Always include manual review steps for critical decisions or significant changes.
# Define decision criteria
decision_rules = {
    "auto_approve": {
        "accuracy_improvement": ">= 2%",
        "cost_increase": "<= 10%",
        "latency_increase": "<= 200ms",
        "statistical_significance": "p < 0.05"
    },
    "auto_reject": {
        "accuracy_decrease": ">= 1%",
        "cost_increase": ">= 25%",
        "latency_increase": ">= 500ms"
    },
    "requires_review": {
        "mixed_results": True,
        "edge_case_regressions": "> 5 cases"
    }
}

# Apply rules to comparison
decision = comparison.apply_rules(decision_rules)

if decision.outcome == "auto_approve":
    print(f"✅ Automatically approved: {decision.reasoning}")
    deployment.promote_to_production(candidate.id)
elif decision.outcome == "auto_reject":
    print(f"❌ Automatically rejected: {decision.reasoning}")
else:
    print(f"⏸️ Manual review required: {decision.reasoning}")
    slack.notify_team(f"Experiment comparison needs review: {comparison.url}")