Design and execute end-to-end workflows by connecting dataset sources, website utilities, prompt nodes, and dataset sinks on a visual canvas. Save flows, reopen from your library, and run them against selected dataset samples with progress feedback.
Basic website crawl & feature extraction flow
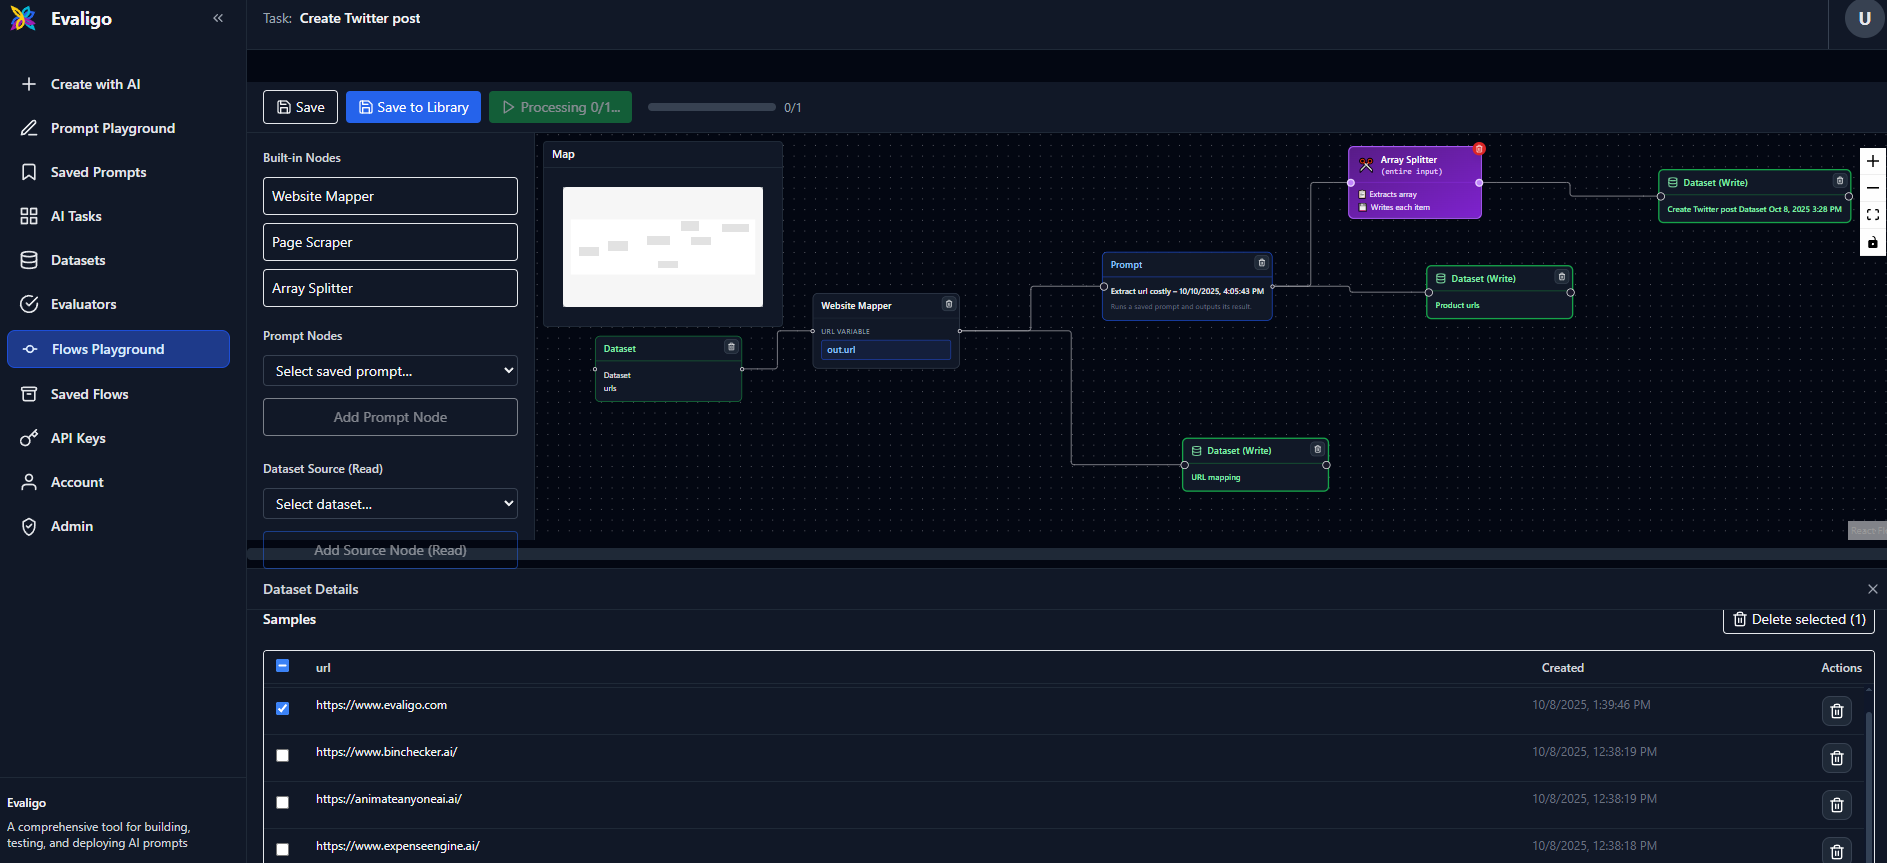
Build and run a flow
- 1
Open Flow Playground Start from the Flow Playground. If no task exists, one is created automatically and the URL includes the
taskId. - 2
Add nodes from the palette Drag in Dataset Source/Sink, Website Mapper, Page Scraper, Array Splitter, and Prompt (from your saved prompts).
- 3
Connect nodes and map variables Create a connector to open the mapping editor. Map left-side variables (e.g.,
out,_input, orout.field) to the right-side inputs (e.g.,in, prompt variables, or dataset fields). - 4
Select dataset samples Click a dataset node to open the dataset panel, then select samples to run. You can also add sample rows inline.
- 5
Run the flow Use Run Flow to process selected samples sequentially. Progress and failures are tracked; dataset sinks write results automatically.
- 6
Save and reuse Click Save to persist the current graph to the task, or Save As to store a reusable template with title and description.
Node catalog
- Dataset Source (Read): Reads rows from a selected dataset. Outputs include
out,_input, andout.<field>for schema variables. - Dataset Sink (Write): Writes incoming results to a selected dataset. Can be chained further if needed.
- Website Mapper: Accepts a URL variable (map from left) and emits processed outputs with input pass-through.
- Page Scraper: Extracts page content via a CSS selector (e.g.,
article,.content). - HTML Text Extractor: Cleans HTML and extracts plain text from web pages.
- Iterator (Array Splitter): Splits an array field (e.g.,
resultsordata.items) into individual items for downstream processing. - Array Flatten: Flattens nested arrays into a single array.
- Prompt: Runs a saved prompt. Inputs include a generic
inplus one handle per prompt variable. - API Input: Define input fields for API deployment. Configure field names, types, and validation.
- API Output: Define what data to return when flow is deployed as API.
Connectors and variable mapping
Every processing node exposes a main output out and an input pass-through _input. This lets downstream nodes access both processed results and original inputs. When connecting:
- Left options:
out,_input, and for dataset sources alsoout.<field>. - Right options: For prompts,
inplus prompt variables; for datasets,inplus schema fields; website mapper expectsurlVar.
Canvas controls
Navigation
- Pan: Click and drag the canvas background
- Zoom: Mouse wheel or pinch gesture
- Fit View: Click the fit button in controls to center all nodes
- Mini map: Use the mini-map overlay to navigate large flows
Node operations
- Add node: Click or drag from palette, or right-click canvas
- Move node: Click and drag any node
- Delete node: Select and press Delete/Backspace, or use node's delete button
- Duplicate node: Right-click the node, then choose Duplicate
- Configure node: Click node to open configuration panel
- Disable node: Use power button on node to disable without deleting
Connection operations
- Create connection: Drag from output handle (right) to input handle (left)
- Edit mapping: Click any connection to edit variable mappings
- Delete connection: Select and press Delete/Backspace, or delete in mapping editor
Saved flows library
Use the Saved Flows view to browse, search, rename, and delete saved flows. Open any flow in the playground via Open in Playground.
Features:
- Search flows by title or description
- View flow details and preview
- Edit flow metadata (title, description)
- Deploy flows as APIs
- Delete unused flows
Shortcuts and tips
- Context menu: Right-click the canvas to add nodes at cursor; right-click a node to duplicate or delete
- Delete/Backspace: Remove selected nodes and connectors
- Mini map & controls: Navigate large graphs efficiently
- Auto-save: Changes are auto-saved when you add/remove nodes or connections
- View Structure: Click to see flow structure as text for debugging
Dataset panel
When you click a Dataset Source or Dataset Sink node, the dataset panel opens at the bottom of the screen:
- View samples: See all samples in the dataset
- Select samples: Choose which samples to process in your flow
- Add samples: Add new data directly from the flow canvas
- Manage dataset: Rename, edit schema, or open in datasets page
Execution monitoring
When you run a flow, you get real-time feedback:
- Progress bar: Shows X/Y nodes completed
- Node status: Nodes turn blue (processing), green (completed), or red (failed)
- Timing badges: See execution time above each node
- Total time: Overall flow execution time displayed
- Error messages: Failed nodes show error details on hover